Featured products
-
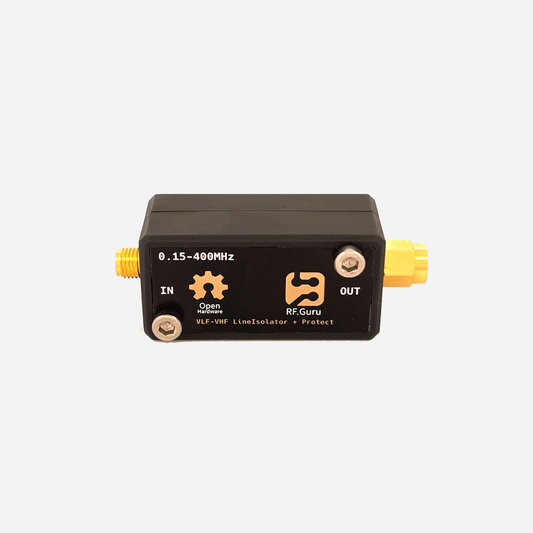
2022-PA-063 | RX Galvanic Isolator + Protector + Limiter (1 MHz - 400 MHz)
Regular price €88,50 EURRegular priceUnit price per -
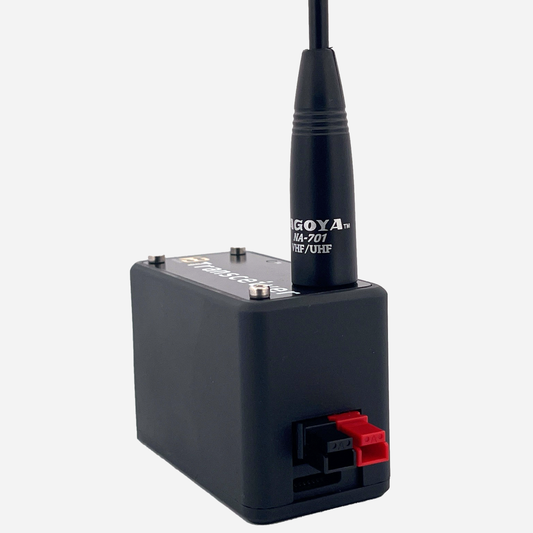
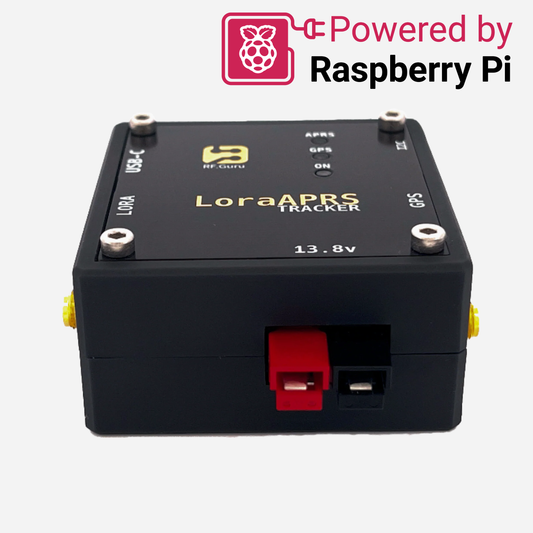
2023-PA-521 | 13.8v LoRa APRS Automotive Tracker 433 Mhz 500 mW
Regular price €134,08 EURRegular priceUnit price per -
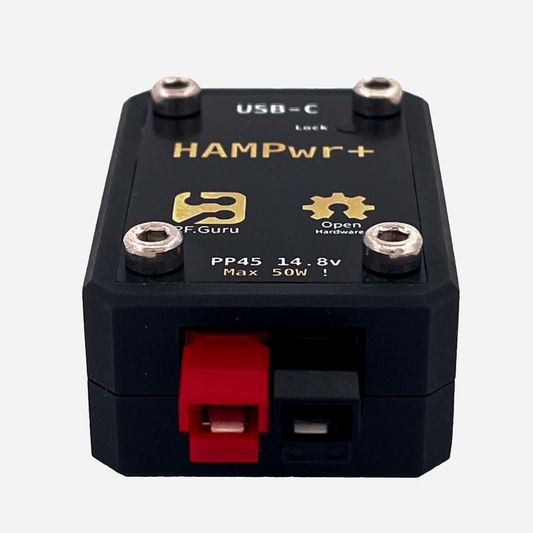
2022-PA-090 | HAMPwr+ USB-C PD to 14.8V
Regular price €71,00 EURRegular priceUnit price per -
2023-PA-141-U | Assembled Analog Transceiver 70cm UHF 1.3W 13.8v
Regular price €0,00 EURRegular priceUnit price per -
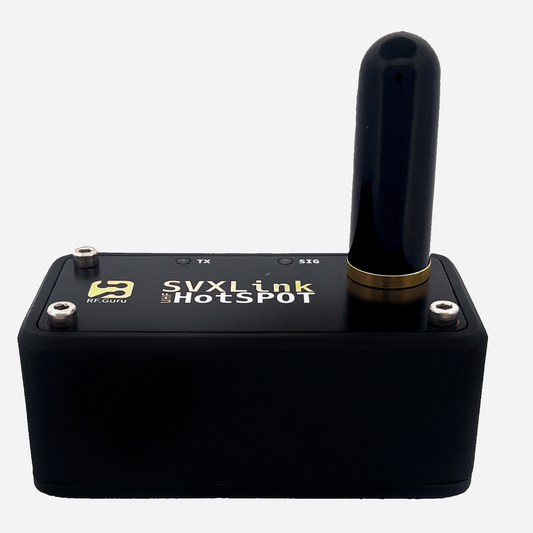
2023-PA-041-U | Assembled SVXLink Analog HotSPOT 70cm UHF 500mW
Regular price €145,05 EURRegular priceUnit price per

New Products
-
2022-PA-063 | RX Galvanic Isolator + Protector + Limiter (1 MHz - 400 MHz)
Regular price €88,50 EURRegular priceUnit price per -
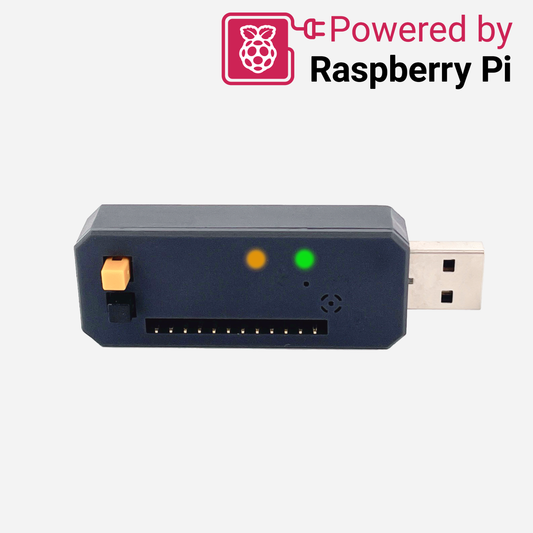
2022-PA-104 | µPico Stick
Regular price €46,50 EURRegular priceUnit price per -
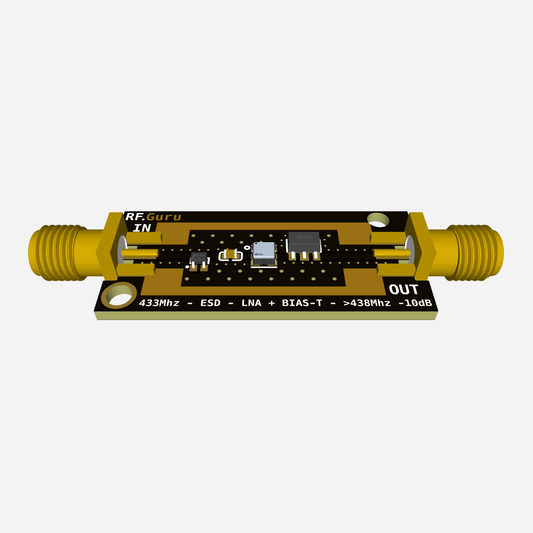
2023-P-213 ESD + SAW + LNA 433mHz (LoRaAPRS) + 18dB Gain
Regular price €24,50 EURRegular priceUnit price per -
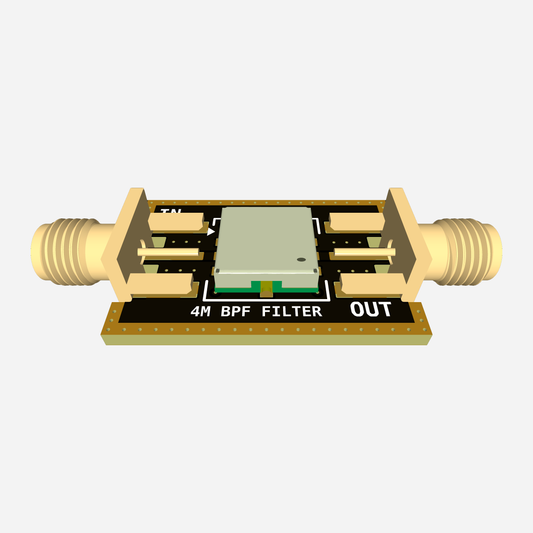
2024-P-092 4M Band Pass Filter
Regular price €23,00 EURRegular priceUnit price per -
2023-PA-141-V | Assembled Analog Transceiver 2m VHF 1.3W 13.8v
Regular price €0,00 EURRegular priceUnit price per